I’m new to macOS application debugging and could use some help finding a way.
I’m running a Vuo composition that accomplishes continuous video playback (as much as possible without gaps) and comprises of 2 video players, taking times preloading and playing video files. There is also a syphon client for mixing a second image layer on top of the video layer.
How should I go about debugging this “run out of application memory”?
I’m running this on a 2018 Intel Mac Mini with 16GB Ram.
I run into this situation, which causes the termination of this application, anywhere between “after more than 15 days” and “after more than 5 days”, of continuous playback.
Thank you very much and sorry for the very generic request.
In our experience, likely causes of a “run out of application memory” error after running an application for a while are:
The application is using more and more memory (a memory leak) until it exhausts the available RAM / virtual memory.
The system startup disk is full. (macOS stores the swap files for virtual memory there.)
The second cause is easier to check. In Finder, locate the volume for your startup disk (under Go > Computer), click on it, and see how much Finder says is available in the bottom bar of the window. If there’s less than about 10 GB, free up some space, then reboot and see if the problem still occurs.
If that doesn’t fix it, then you can check if Vuo, the Syphon client, or another application is using more and more memory over time. In Applications > Utilities > Activity Monitor, select the Memory tab and View > All Processes, and make sure the table is sorted from highest to lowest memory usage. Since you’re diagnosing a fairly slow leak, I’d suggest taking a screenshot of Activity Monitor at the beginning and another after a few hours to see how they compare.
If you find that the problem is caused by Vuo, please let us know. To debug it, we’d need more information (such as providing the composition and the video files) so that we can reproduce the problem. We’d run the composition with Apple’s Instruments to locate the code that is leaking memory.
Xcode and Instruments still very foreign to me, so I’m asking for your help again.
I’m attaching a zip file with a working system for this composition, with a reduced sample playlist and video files.
The composition depends on a basic HTTP server binary that is included (that just reads the playlist file and manages playback index (and seek value for first launch)).
I’m not including the companion syphon composition because it seems there’s no relation to the specific memory leak.
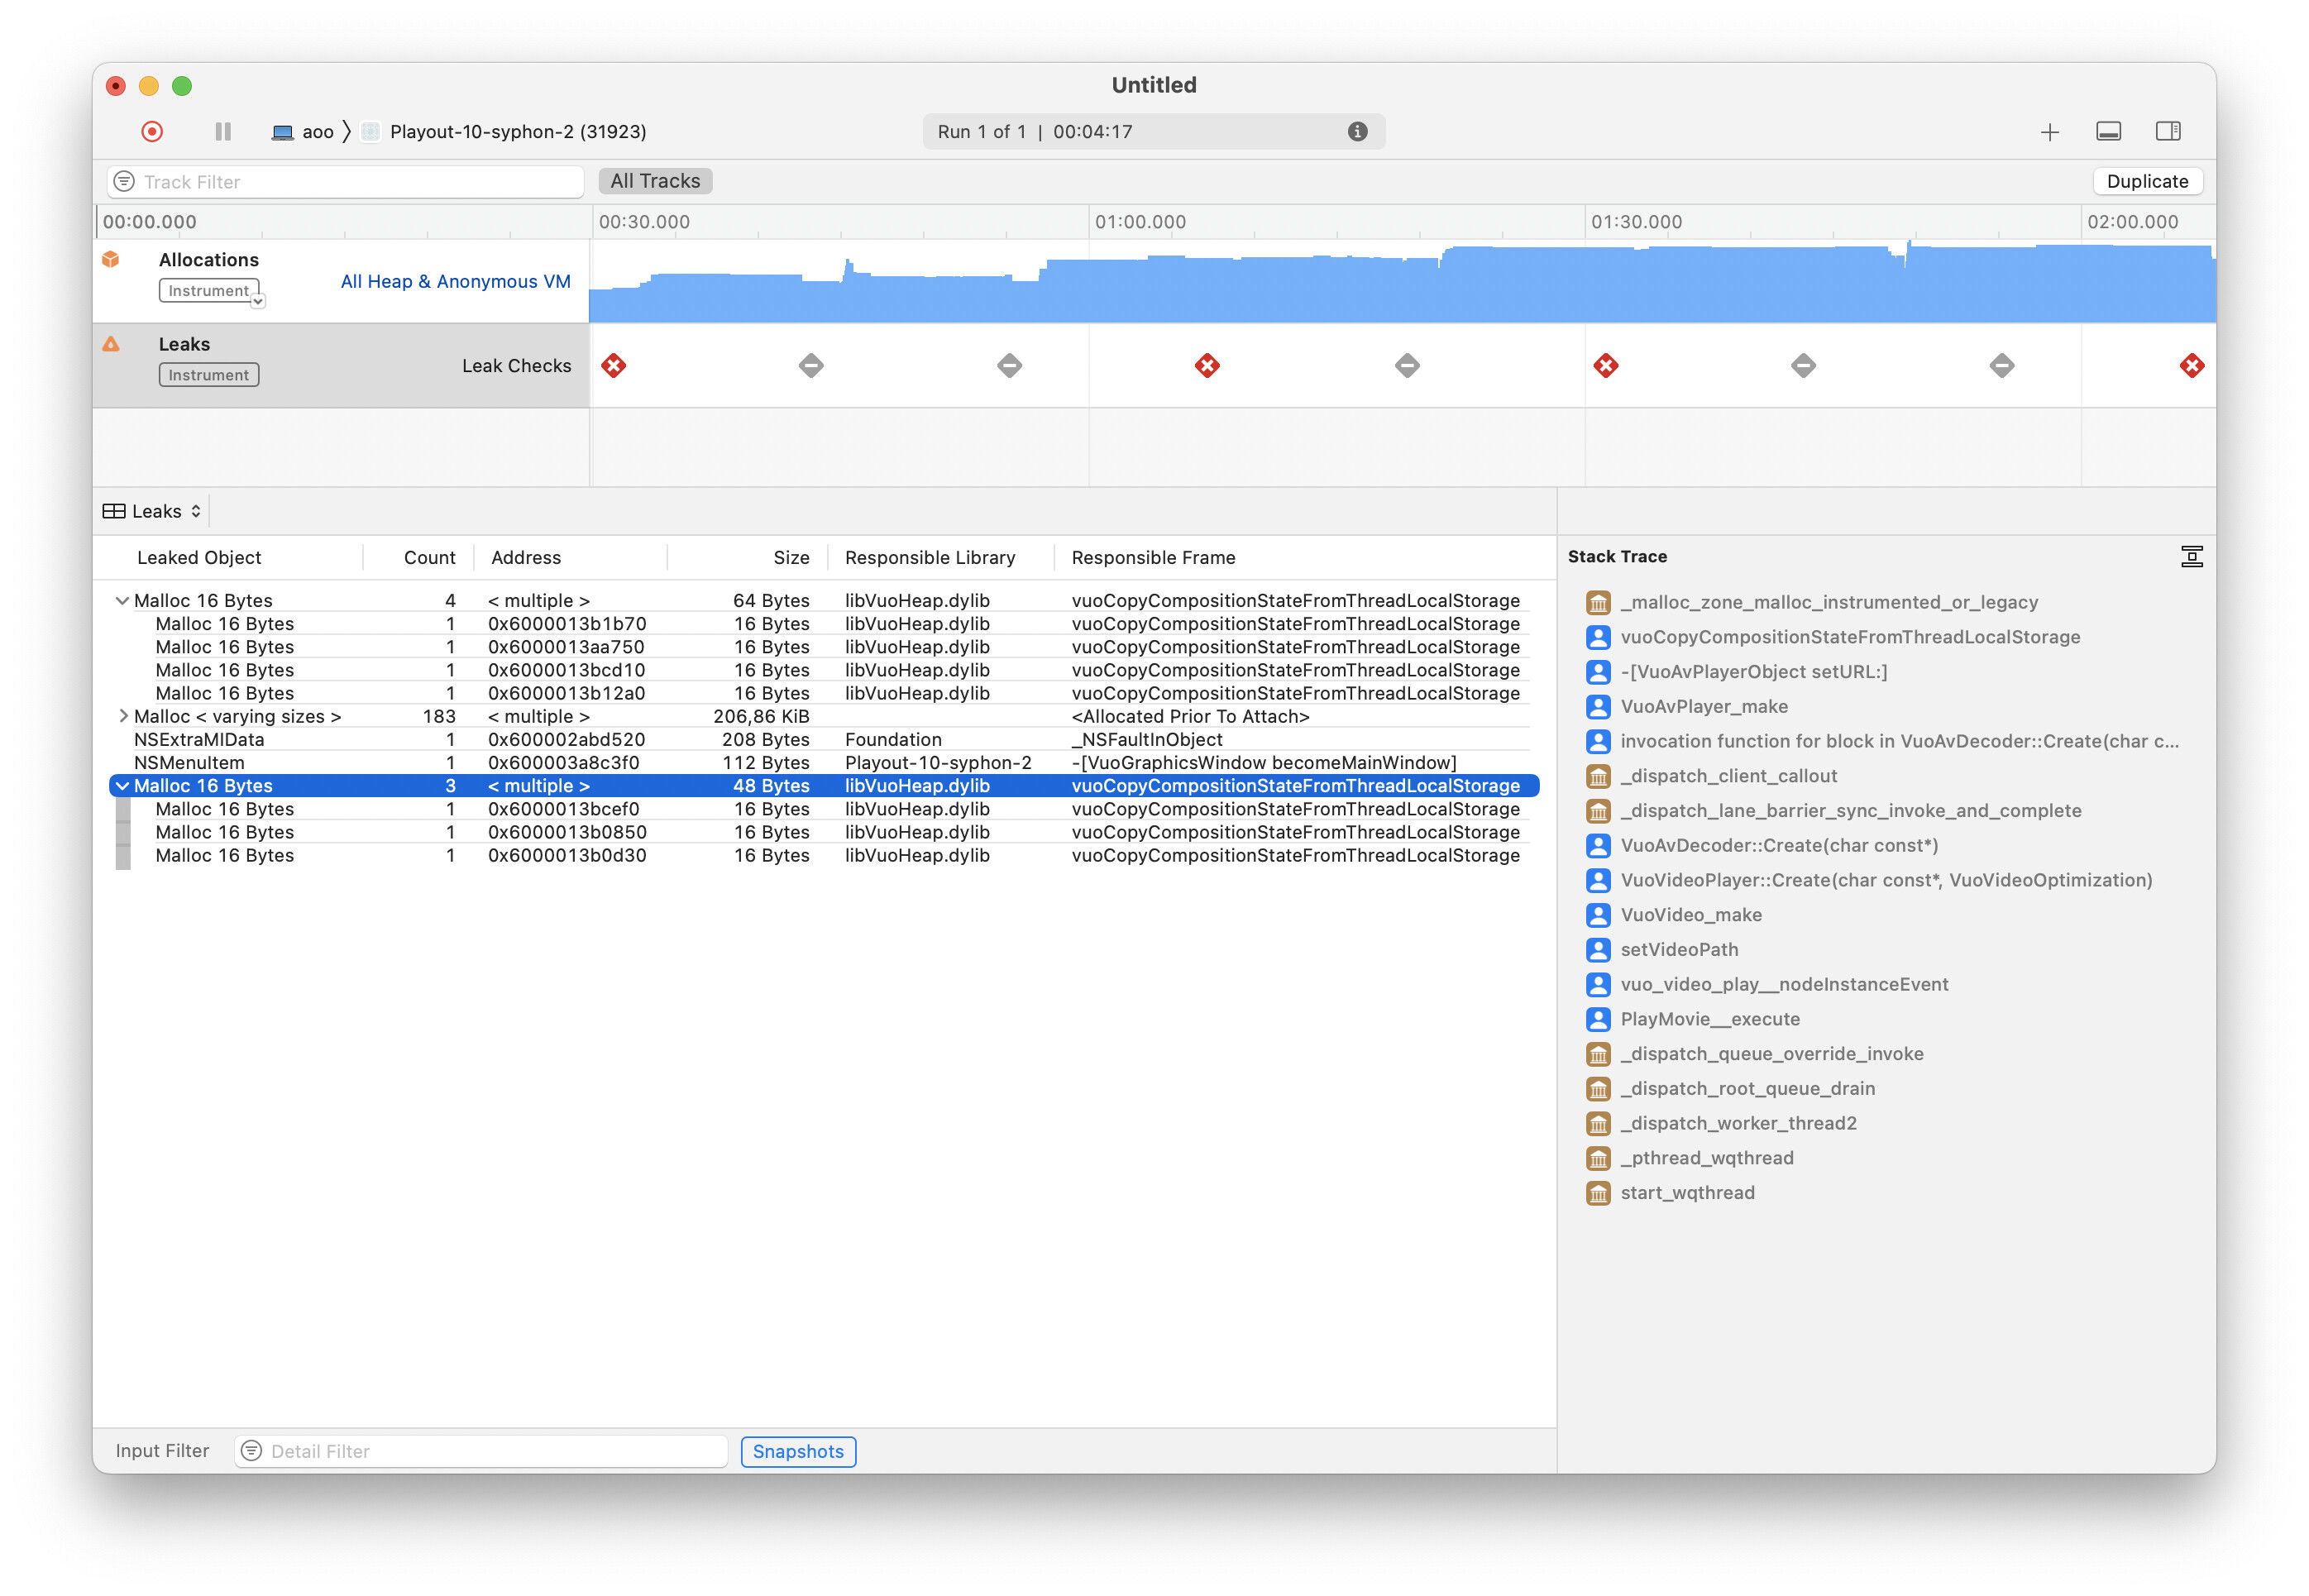
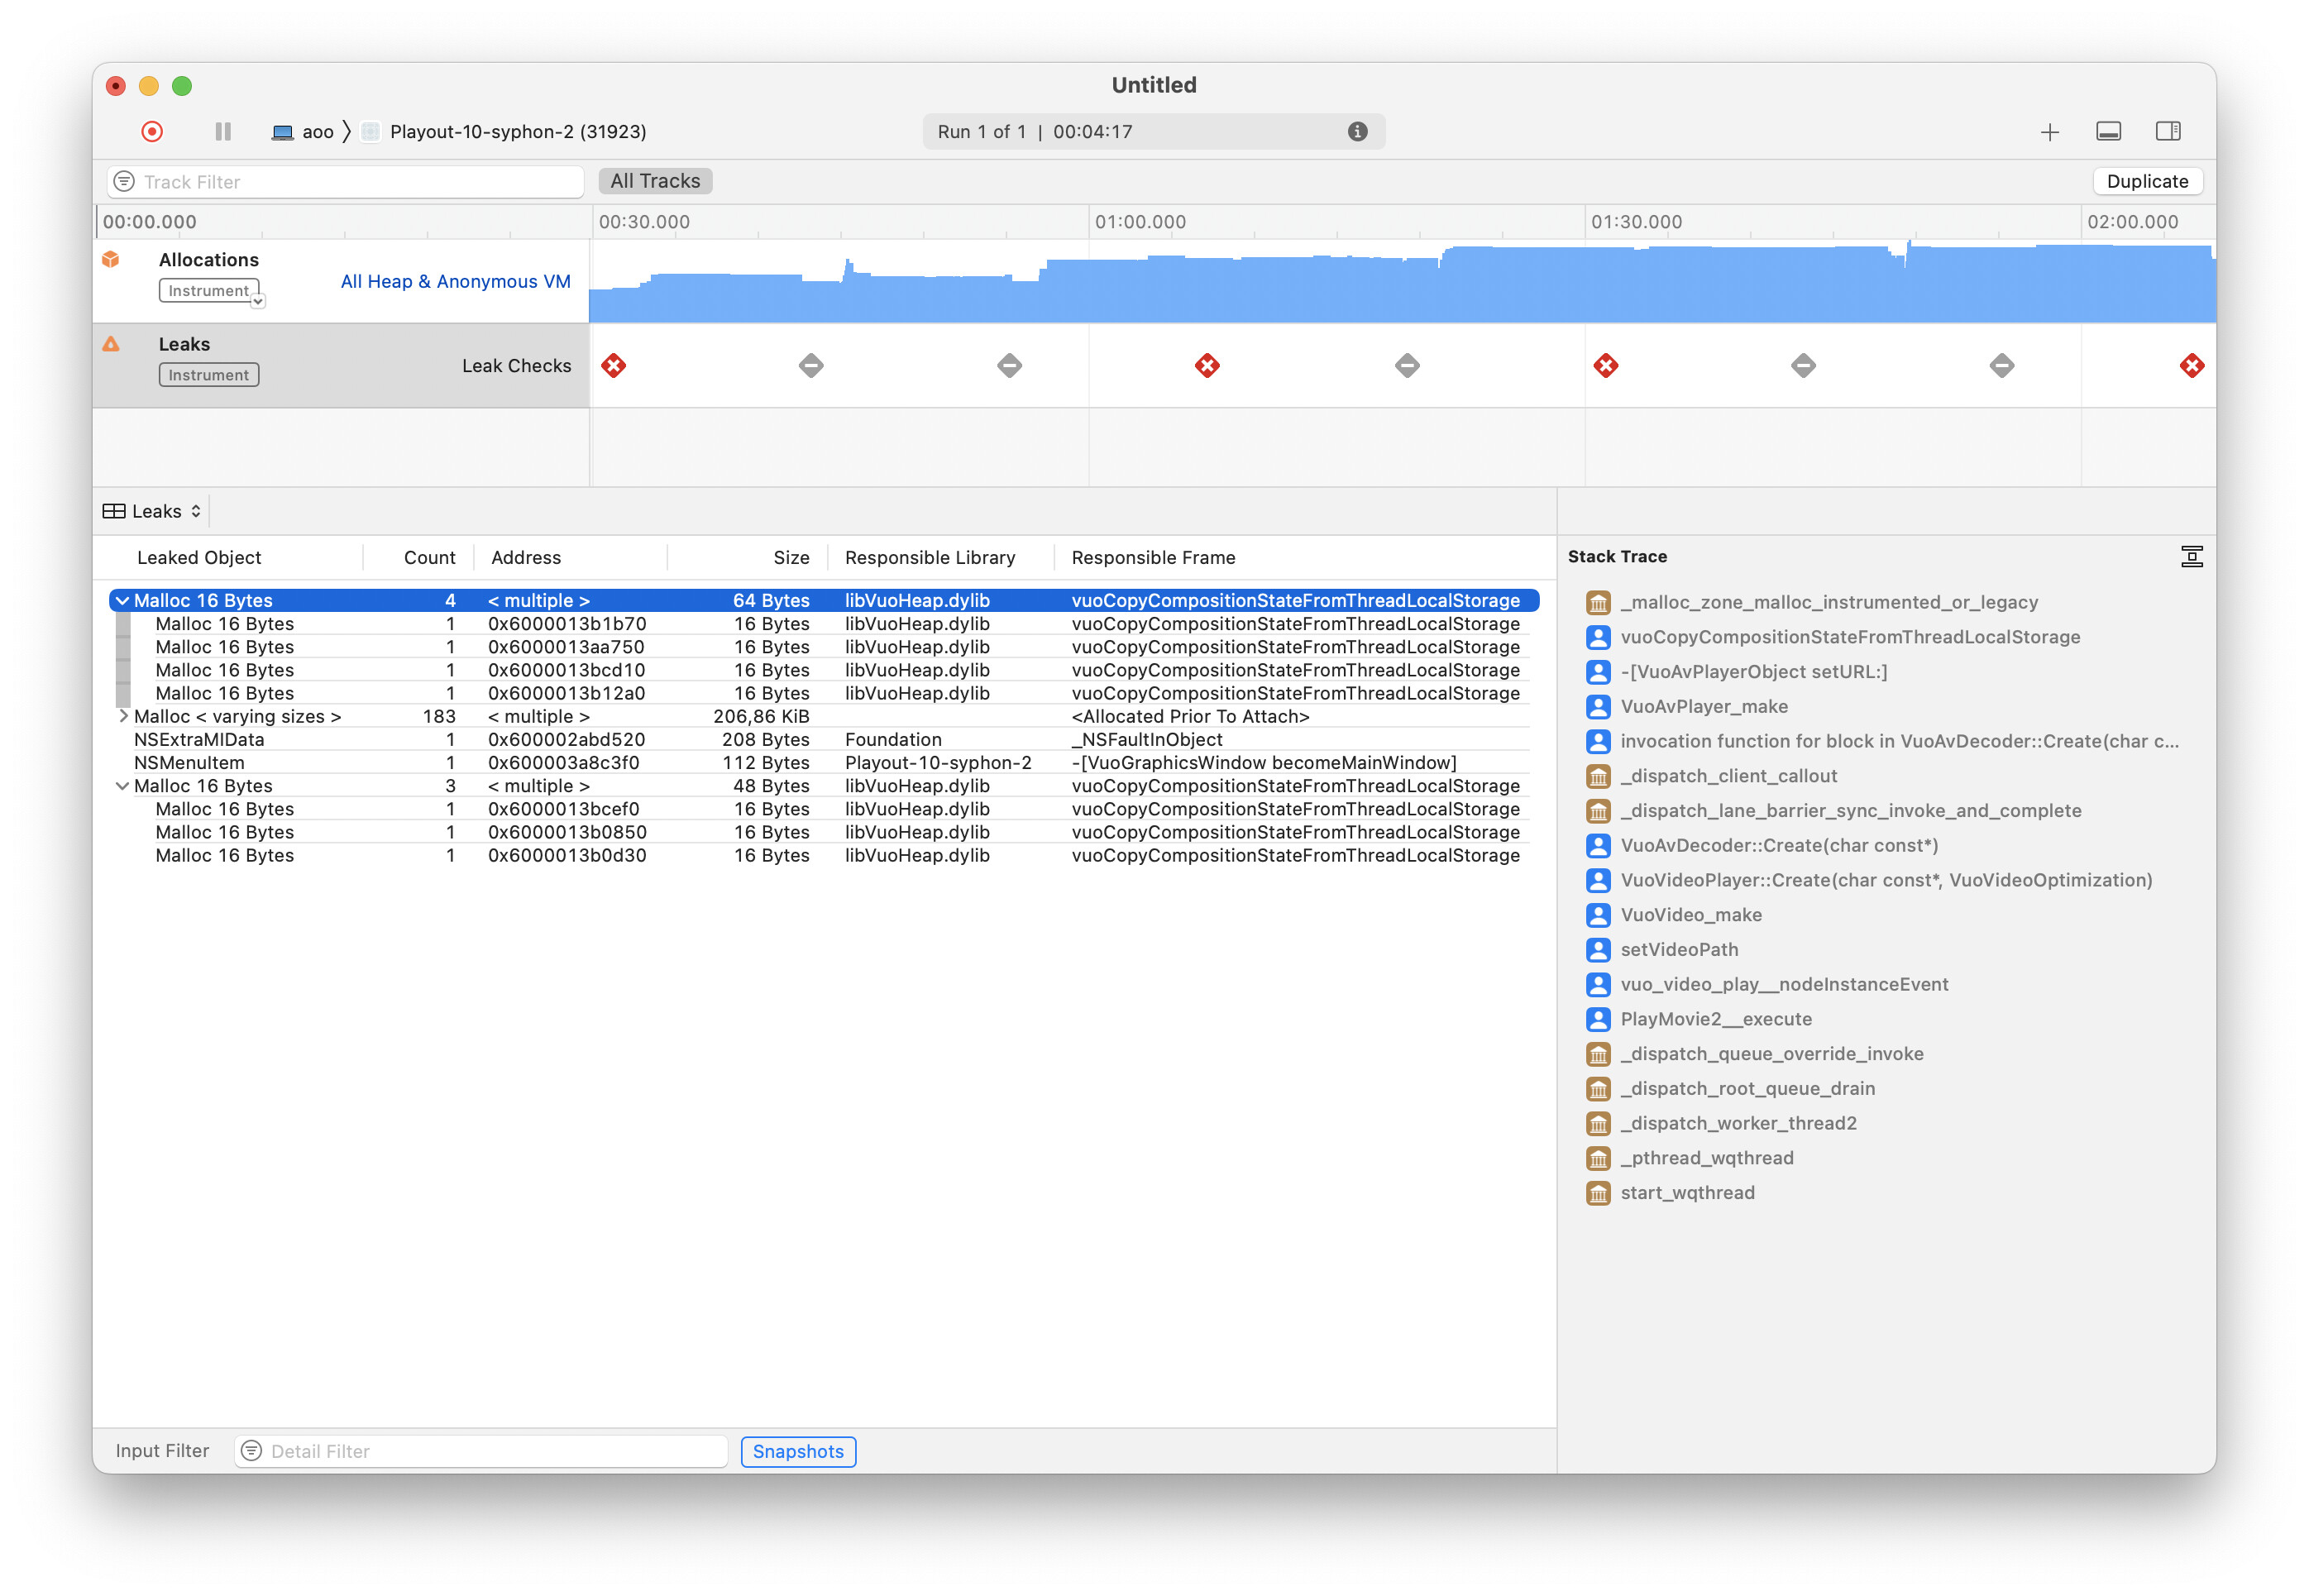
We analyzed your composition with Instruments and didn’t find any memory leaks that would explain the out-of-memory error you’re seeing. We first checked the composition process (with the HTTP server binary running). We also checked it with Syphon input, and looked at a variation on the composition that seeks the video to random times. We also checked the Vuo editor process, your HTTP server binary process, and a composition that sends Syphon. Instruments reported some small leaks, but nothing large enough that it would be likely to exhaust the system’s memory in 5-15 days.
Do you know for sure that the problem happens with this reduced setup? Perhaps it only happens with the full setup. For example, the Vuo composition might leak only when playing certain types of video files, or the leak could be in some other application that was not included here.
From your screenshots, I would guess that you’re running the composition as an exported app, rather than from the Vuo editor. If not, that might be worth a try. It would at least eliminate one variable in the experiment.
If you wanted to do more testing with Instruments, it looks like you are going about it the right way. The main thing you’d want to look for is the size of the leak. The ones “allocated prior to attach” are probably not relevant here. What you’d be looking for is ongoing leaks as the process runs. If you track the process for 30-60 minutes, making sure to test all parts/functionality of the composition, do you see any leaks large enough to add up to gigabytes over several days?
If your additional testing does lead you to believe that the problem is in Vuo, please let us know how we can reproduce the leak and we’ll investigate further.