Not sure if this belongs in the Vuo SDK category, but a node that records/displays the execution time of a node/nodes could come in handy. This to check own custom code nodes, subcompositions or part of a composition. Maybe something like this:
Would the Feature Request Add processing time in tooltips for each node meet your requirements? If the goal is just to measure the execution time of one node for development/debugging, then perhaps that FR would be sufficient.
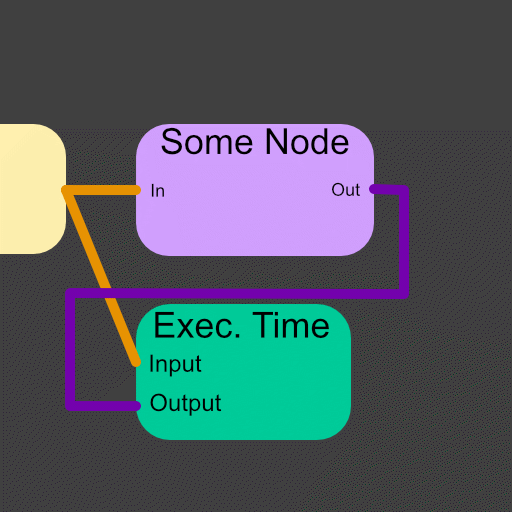
You can measure the execution time now, as shown in the attached composition, although it’s not as simple as a tooltip addition or single node.
@useful_design not sure how this would relate to a state management feature? See reply below.
@jmcc Kind of, but maybe not quite :) I’m thinking very basic [event time out] - [event time in] = output. I could maybe have made it myself, but I frankly don’t trust my skills enough to make something accurate enough for this purpose.
While a tooltip would be nice for checking custom nodes, it would mean having to calculate the sum of multiple nodes when comparing different approaches which I don’t find as useful. I can also see the port popover management become tiresome really fast in larger compositions.
For single nodes it would also just be a matter of connecting this parallel to the node to get the execution time for a single/custom node.
You can do this with a subcomposition, as long as you use the Spin Off Event node. My colleagues have provided an example.
If you would like to use a built-in node, it would be straightforward for us to build one, using the subcomposition. The same limitation of needing a Spin Off Event node would apply.