Hi guys !
Trying to adapt the built-in “Show Audio Frequencies” to react to several layers heights instead of a moving line strip mesh.
I want to use Calculate Amplitudes for Frequencies as used in the sample for a human visualization of the sound.
However, I would like the elements to be linearly x positioned on the screen instead of exponentially out (as in the sample, they concentrate right on the screen).
But when x positioned linearly, the Amplitudes mainly affect only the heights of the layers left on the screen.
So the question is, would it be possible, to scale or multiply the Amplitude List, to fake a linear spread (to reverse it to non exponential) ?
I’m bad at log maths etc. so I’m banging my head in an empty space.
Perhaps it’s not even possible !
I guess if it could be spread, the EQ would not represent a real spectrum anymore, but anyway ;)
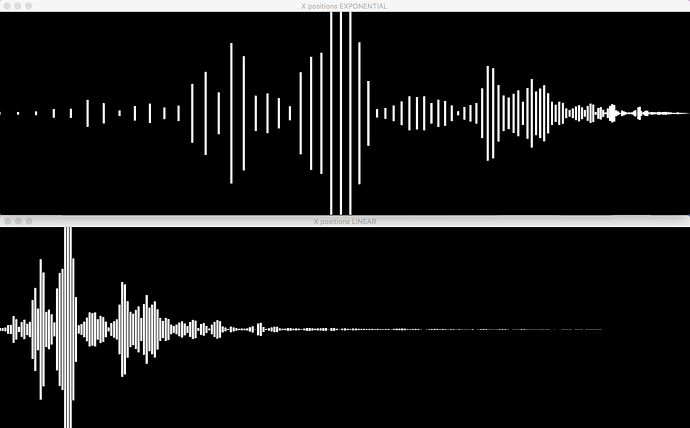
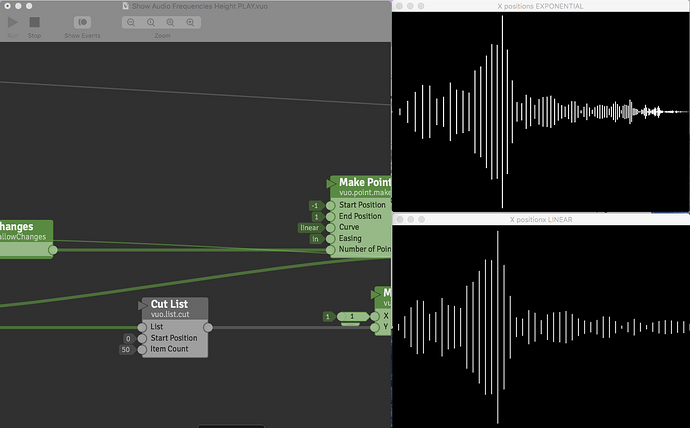
Including the composition, 2 windows, one with the exponential x position, one with the linear ones.
Hope I’m clear, any help welcome.
Image :
Top Image : Line heights spread equally on the screen, x positions right exponential out.
Bottom Image : Line heights left concentrated, x positions linear equal.
Show Audio Frequencies Height.vuo (13.2 KB)
The only way I can somehow fake the thing so far is by cutting the List from 255 to 50 elements from the start, for the linear version, as it seem for regular sound like songs, it’s often the first Amplitudes of the list are active, but then I’m missing the 205 ones … ;)
This sounds like a really dumb question again ;)
On the Calculate Amplitudes for Frequencies node, you have the Frequency Bin Averaging set to None. Try changing it to Quadratic or Logarithmic (with Make Points Along Curve set to Linear). Where None would bunch up all your tall bars on the left side, Quadratic or Logarithmic will give you some tall bars all the way across.
@jstrecker thanks for answer !
Yes you’re right ! Looks better in Quad or Log but then the max. list output is 65 or 12 :( Which is quite few for detailed spectrum no ?
That’s why I came to try to use the calculate node and some functions attached to some scale list or multiply list to somehow reverse spread it, but I came up to nothing.
Perhaps it’s just not possible.
Sorry, perhaps should this be in discussion rather then in Q&A.
The number of Frequency Bins is limited to how many would make sense for audio with a sample rate of 48 Khz, based on the math behind the Calculate Amplitude for Frequencies node (Fourier Transform).
With a sample rate of 48 Khz, you can analyze frequencies up to 24 Khz.
With Frequency Bin Averaging set to None, you’re basically dividing up the range from 0 to 24000 Hz into equal-size bins (the vertical lines in your composition). With 2047 bins, each bin is about 11.7 Hz wide.
Trouble is, our ears and brains divide up frequencies very differently. If you play a middle C note, that’s 261.6 Hz. If you play the next C above that, it’s 523.3 Hz. The next C above that is 1046.5 Hz. Each time you go up an octave, it doubles. So, while the octave from the lowest C to the next C on the piano covers 32.7 to 65.4 Hz (a range of 32.7 Hz), the octave from the second-highest C to the highest C on the piano covers 2093.0 to 4186.0 Hz (a range of 2093.0 Hz).
Coming back to those frequency bins that are 11.7 Hz wide — 11.7 Hz covers a lot of a low-pitched octave, but only a little of a high-pitched octave. That’s why your graph ends up with the tall bars bunched up on the left.
To get around this, you’d generally set Frequency Bin Averaging to Quadratic or Logarithmic. This groups the bins together to better match how we hear. The groups are narrower at lower frequencies and wider at higher frequencies — similar to how octaves cover a narrower range at lower frequencies and a wider range at higher frequencies.
With Logarithmic, the largest group covers approximately from 12000 Hz to 24000 Hz. That’s a big group — it means the rightmost bar in your graph represents half of your frequency range. The second-largest group is half that size, covering approximately 6000 Hz to 12000 Hz. Each subsequent group is half the size of the previous, until finally you get down to one that goes from 11.7 Hz to 23.4 Hz. The lowest group covers the lowest C on the piano, and the highest group covers 2 octaves higher than the highest C on the piano. The Logarithmic bin averaging is similar to how octaves work, but because of that, it outputs very few groups.
1 Like

